Convenience function that automatically creates an appropriate plot
for mcc objects. This is called when using the base R plot() function.
Examples
# Create sample data
library(dplyr)
library(ggplot2)
df <- data.frame(
id = c(1, 2, 3, 4, 4, 4, 4, 5, 5),
time = c(8, 1, 5, 2, 6, 7, 8, 3, 3),
cause = c(0, 0, 2, 1, 1, 1, 0, 1, 2),
treatment = c("Control", "Control", "Treatment", "Treatment",
"Treatment", "Treatment", "Treatment", "Control", "Control")
) |>
arrange(id, time)
# Calculate MCC
mcc_result <- mcc(df, "id", "time", "cause", by = "treatment")
#> ℹ Adjusted time points for events occurring simultaneously for the same subject.
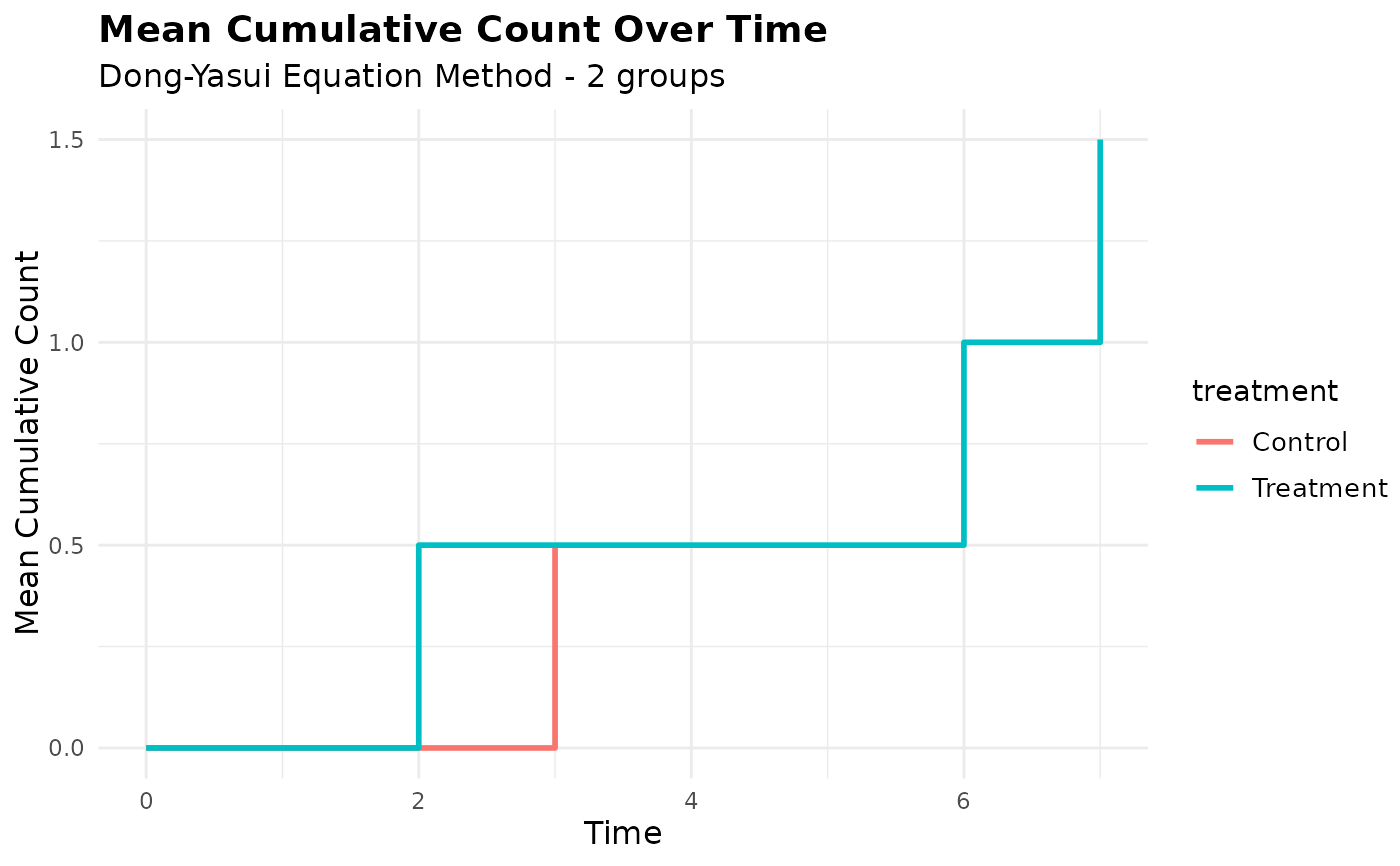
# Use autoplot (ggplot2 style)
p <- autoplot(mcc_result)
print(p)
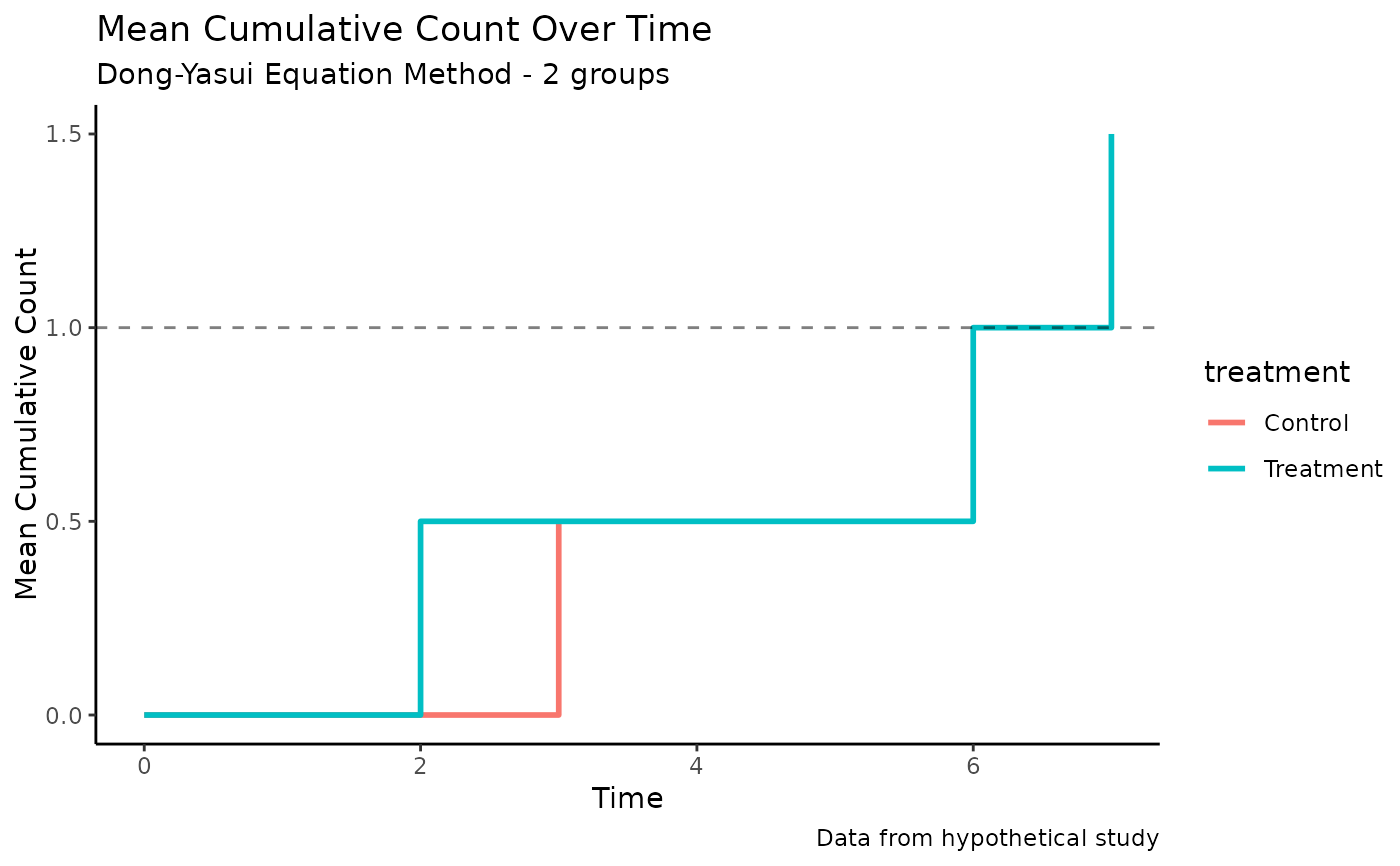
 # Customize with ggplot2 functions
p_custom <- autoplot(mcc_result) +
theme_classic() +
labs(caption = "Data from hypothetical study") +
geom_hline(yintercept = 1, linetype = "dashed", alpha = 0.5)
print(p_custom)
# Customize with ggplot2 functions
p_custom <- autoplot(mcc_result) +
theme_classic() +
labs(caption = "Data from hypothetical study") +
geom_hline(yintercept = 1, linetype = "dashed", alpha = 0.5)
print(p_custom)
 # Clean up
rm(df, mcc_result, p, p_custom)
# Clean up
rm(df, mcc_result, p, p_custom)